Data-driven Insights with Power BI
Welcome to my portfolio! where data meets creativity & drive business growth
"Leverage Power BI and Power Query for my data mastery. I ensure accurate, comprehensive data through meticulous cleaning and transforming. I create dynamic reports and user-friendly dashboards, featuring advanced elements like drill-through and custom slicers. Witness my expertise in data storytelling, empowering businesses with actionable insights"
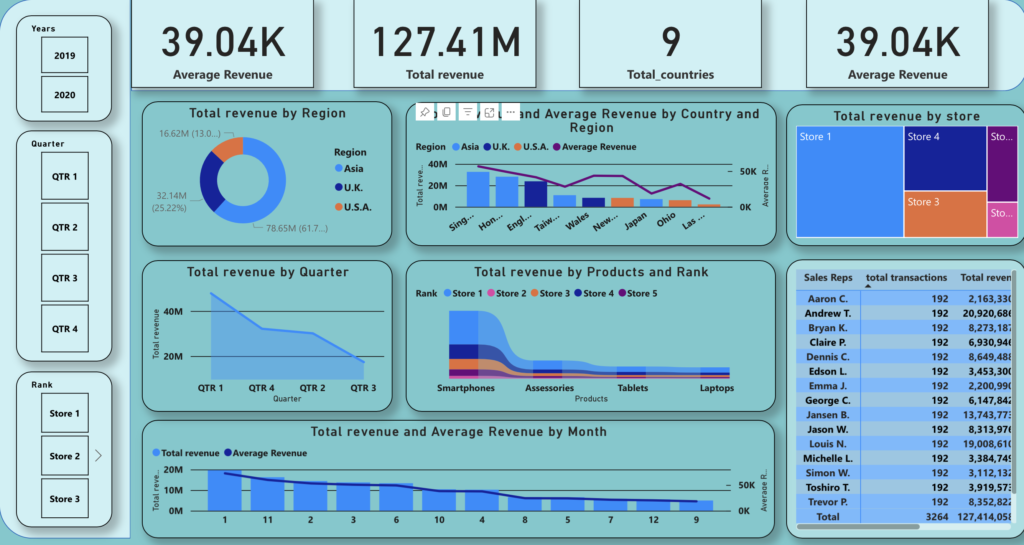
The “Financial Analysis Dashboard” created in PowerBI is designed to provide valuable insight into the financial performance of a business. Through the use of interactive visualizations, the dashboard showcases the total revenue by region, country, store, quarter, product, and ranks. It also highlights the total revenue and average revenue by month. With its user-friendly design and intuitive interface, the dashboard makes it easy for users to explore the data and gain a deeper understanding of the factors that contribute to the success of a business. By presenting the data in a clear and concise manner, the dashboard offers valuable insights into the financial health of a company and its potential for growth.

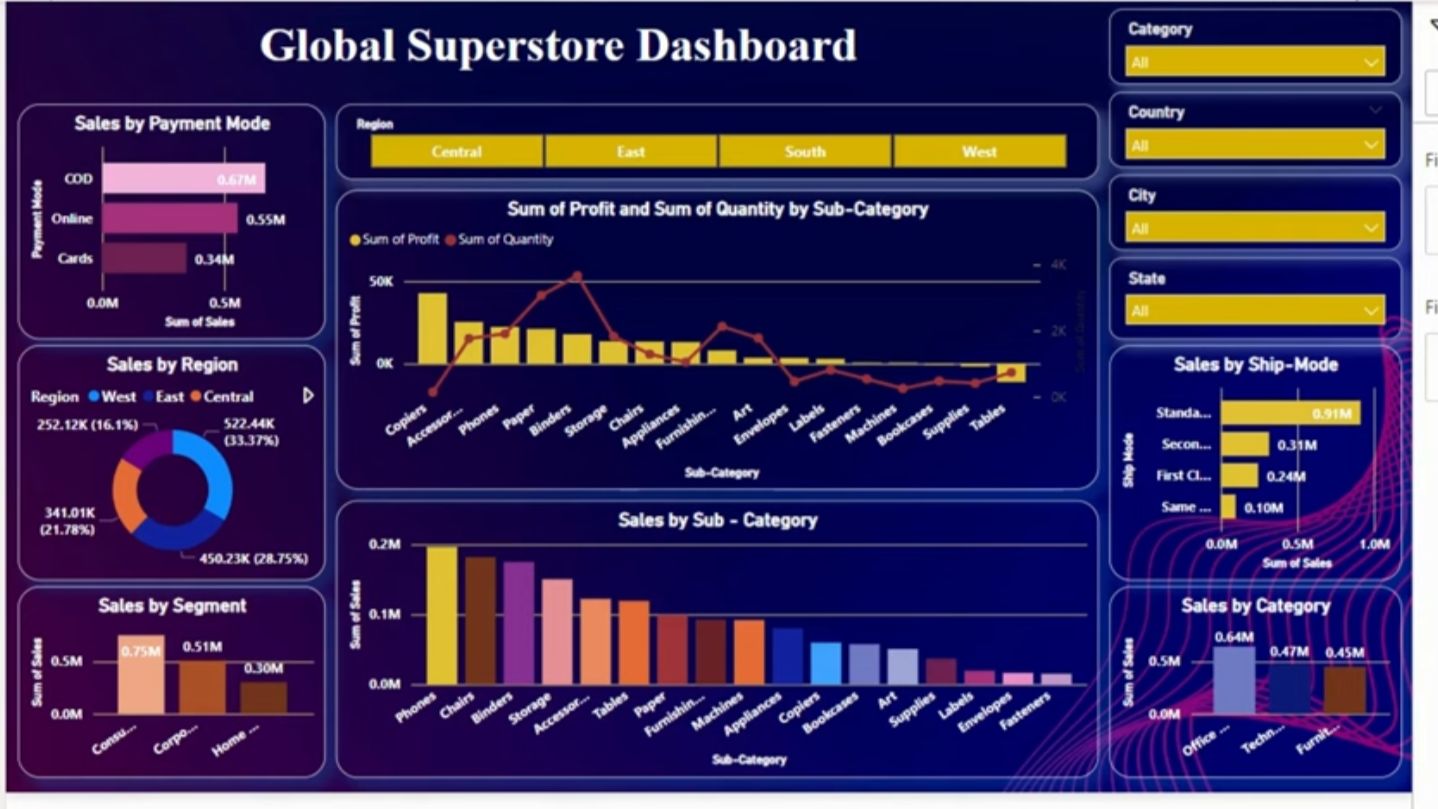
Experience a demonstration of data prowess through this dashboard project, unveiling insights via data source connection, transformation, and visualization. Explore dynamic sales patterns across categories, subcategories, regions, and segments, enhanced by interactive features like slicers and filters. This expertly crafted dashboard showcases the art of data storytelling and empowers seamless data exploration, fostering data-driven decision-making for success within your organization. The project’s usefulness lies in its ability to provide a clear understanding of sales dynamics, enabling strategic planning, targeted interventions, and informed choices based on comprehensive insights.

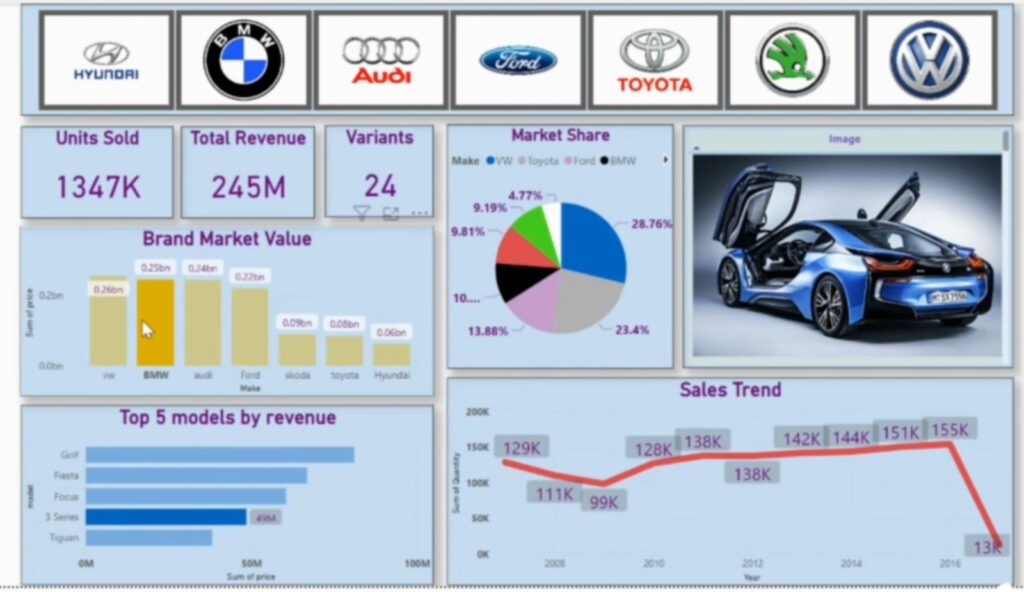
Explore a compelling Power BI project revealing vital insights from Norway’s car sales data. Interactive visualizations spotlight unit sales, revenue, and market share, supported by advanced data techniques and dynamic filtering. This skillful data transformation into actionable intelligence is complemented by innovative car image changes linked to filters. Embark on a data-driven journey, mastering visual storytelling and strategic decision-making within the automotive landscape. This project is particularly useful for businesses, analysts, and enthusiasts seeking data-backed guidance for market understanding, performance optimization, and effective communication.

Let's Work Together
Ready to collaborate on data-driven projects? I’m eager to bring my expertise in Power BI, Tableau, SQL, Python and data analysis to your team. Let’s turn insights into action and create impactful solutions together. Contact me to explore exciting opportunities
