
Unleashing Tableau Tales
Welcome to my portfolio! where data meets creativity & drive business growth
Step into Tableau's enchanting realm, where data and storytelling intertwine. Explore my vibrant projects, alive with interactive visuals and captivating insights, adding a creative twist to analysis. Embark on a data-driven adventure that unveils patterns and trends, making every project an artistic discovery. Join me in this tableau wonderland, whether you seek sorcery or collaborative escapades, for a thrilling journey.
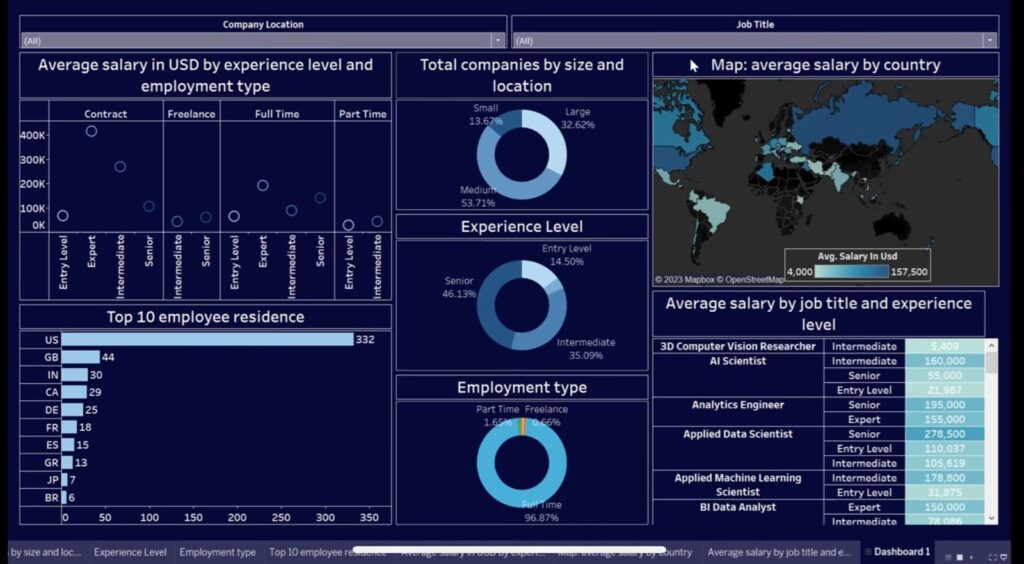
Uncover the intricacies of data science job salaries through an advanced Tableau dashboard. This project offers a comprehensive view of average salaries based on experience, job title, and employment type, along with insights into employee residences, company sizes, and geographic locations. It empowers users to make data-driven decisions, enhancing career choices and recruitment strategies in the dynamic field of data science. By guiding users through the creation of a detailed dashboard, the project fosters skill development and proficiency in Tableau and data analysis techniques
This Tableau dashboard on Netflix offers a comprehensive array of movie-related data, spanning genres, release years, ratings, types, titles, durations, and descriptions. The dashboard’s filters and top 10 genre chart facilitate effortless data filtering, granting a snapshot of popular genres. Enhanced by its adept use of design and color, the project’s purpose is to provide users with an accessible and informative tool for analyzing movie data, aiding in genre preferences, release trends, and viewing choices, thus assisting movie enthusiasts, researchers, and industry professionals in making informed decisions and understanding viewing habits effectively.

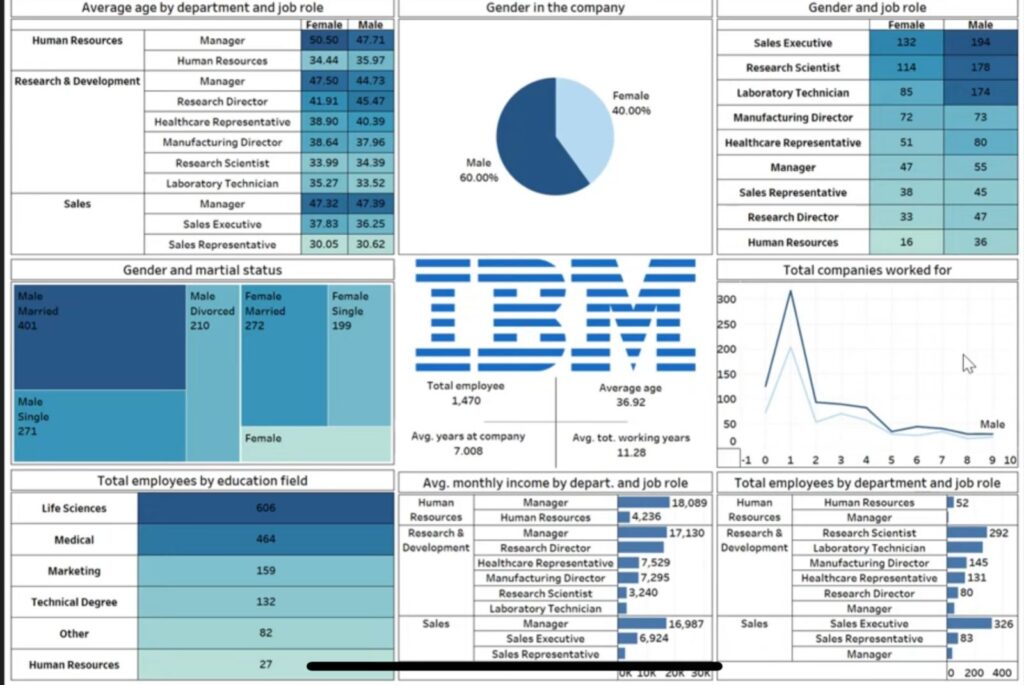
This comprehensive Tableau dashboard illuminates various aspects of IBM’s HR department, encompassing gender, marital status, job roles, education fields, income, and total employees by department. Its advanced visuals distill complex data into an accessible format, empowering HR professionals with valuable insights. The project’s purpose is to facilitate data-driven decision-making, fostering growth and innovation within IBM by enabling informed personnel management strategies, refining departmental dynamics, and optimizing workforce allocation
Let's Work Together
Ready to collaborate on data-driven projects? I’m eager to bring my expertise in Power BI, Tableau, SQL, Python and data analysis to your team. Let’s turn insights into action and create impactful solutions together. Contact me to explore exciting opportunities